WebGL Tutorial
and more

绘制图形

撰写时间:2024-03-30

修订时间:2024-04-15

无需Path的3个方法

ctx.clearRect(0, 0, canvas.width, canvas.height); ctx.strokeStyle = ColorUtils.GetRandomLightRGB(); ctx.strokeRect(10, 10, 100, 100); ctx.fillStyle = ColorUtils.GetRandomSoftRGB(); ctx.fillRect(150, 10, 100, 100);

clearRect方法总是使用一个透明黑色transparent black),即rgb(0 0 0 / 0%)来填充背景。因此在填充背景前无需指定特定颜色值。

strokeRect使用strokeStyle指定的值来描边矩形,而fillRect使用fillStyle指定的值来填充矩形。

strokeRectfillRect参数中宽度或高度可指定为1,这样可绘制一条相应的直线。

ctx.fillStyle = ColorUtils.GetRandomLightRGB(); ctx.fillRect(50, 10, 1, 100); ctx.fillStyle = ColorUtils.GetRandomLightRGB(); let x = 150; for (let y = 50; y <= 200; y += 50) { ctx.fillRect(x, y, 100, 1); }

绘制矩形的状态保存在CanvasRect中,不与CanvasDrawPath混杂,这意味着在调用strokeRectfillRect方法绘制矩形时,不需要使用beginPath方法。而绘制其他图形的方法,则需调用beginPath方法。

interface mixin CanvasRect { clearRect(x, y, w, h); fillRect(x, y, w, h); strokeRect(x, y, w, h); }

Path与子path

一个复杂的图形可以由多个直线、圆弧等图形组成。Canvas 2D使用path子path来管理这些复杂的图形。

Path

实现了CanvasDrawPath接口的对象,均有一个当前默认绘图路径current default path)。有且仅有一个当前默认绘图路径。它不是绘制状态drawing state)的一部分。

以下方法实现了CanvasDrawPath接口:

interface mixin CanvasDrawPath { beginPath(); fill(fillRule = 'nonzero'); fill(path2D, fillRule = 'nonzero'); stroke(); stroke(path2D); clip(fillRule = 'nonzero'); clip(path2D, fillRule = 'nonzero'); isPointInPath(x, y, fillRule = 'nonzero'); isPointInPath(path2D, x, y, fillRule = 'nonzero'); isPointInStroke(x, y); isPointInStroke(path2D, x, y); }

子path

实现了CanvasPath接口的对象,均有一个path。一个path有0或多个子pathsubpath)。在这些对象被创建时,其path则被初始化为0条子path。每个子路径都有1或多个点、直线、曲线,及一个标识该子路径是否闭合的标志。

每条path因此还有一个开始子path的标志。每当创建一条path,或当调用某些API时,则会激活此标志。

以下方法实现了CanvasPath接口:

interface mixin CanvasPath { closePath(); moveTo(x, y); lineTo(x, y); quadraticCurveTo(cpx, cpy, x, y); bezierCurveTo(cp1x, cp1y, cp2x, cp2y, x, y); arcTo(x1, y1, x2, y2, radius); rect(x, y, w, h); roundRect(x, y, w, h, radii = 0); arc(x, y, radius, startAngle, endAngle, counterclockwise = false); ellipse(x, y, radiusX, radiusY, rotation, startAngle, endAngle, counterclockwise = false); }

beginPath

绘制路径时,应以beginPath语句开始。下面画出一条不闭合的3条线段。

ctx.beginPath(); // empty all subpaths in current default path ctx.moveTo(50, 50); // create a subpath ctx.lineTo(150, 50); // add to subpath ctx.lineTo(150, 150); // add to subpath ctx.lineTo(250, 150); // add to subpath ctx.strokeStyle = 'yellow'; ctx.stroke(); // stroke all subpaths in current default path

beginPath方法将当前默认路径下的所有子路径都清空。而后,moveTolineTo方法往当前默认路径添加子路径。stroke方法绘制当前默认路径。

closePath

下面的代码,与上面代码一样,只是先调用closePath闭合路径,然后再调用stroke绘制路径。

ctx.beginPath(); ctx.moveTo(50, 50); ctx.lineTo(150, 50); ctx.lineTo(150, 150); ctx.lineTo(250, 150); ctx.closePath(); ctx.strokeStyle = 'yellow'; ctx.stroke();

比较上面这两段代码,closePath的作用是自动将路径的当前位置的点与路径最前面的点用直线连接起来,从而达到闭合图形的效果。

注意,如意先调用stoke方法再调用closePath方法,则绘制出来的图形仍未闭合。

closePath的副作用

closePath方法有时会有副作用。

ctx.beginPath(); ctx.moveTo(100, 50); ctx.lineTo(200, 50); ctx.closePath(); ctx.strokeStyle = 'yellow'; ctx.stroke();

线条变粗了。lineTo(200, 50)添加一条从100, 50200, 50的子路径,而closePath添加一条从从200, 50100, 50的子路径。这样,这条线段来回被绘制了两次。

因此,如果closePath所产生的子路径在原来的路径中已经存在(方向可能相反),则不需要再次调用closePath

stroke及fill的影响

下面,我们准备以白色绘制一条直线,以黄色绘制一条斜线。

ctx.beginPath(); ctx.moveTo(50, 30); ctx.lineTo(150, 30); ctx.strokeStyle = 'white'; ctx.stroke(); ctx.moveTo(150, 80); ctx.lineTo(200, 150); ctx.strokeStyle = 'yellow'; ctx.stroke();

上面的代码,导致直线不是白色,且线条较粗。

第一次调用stroke时,该路径只有一条水平线,则使用白色绘制了该水平线。而在第二次调用stroke时,该路径下已有水平线及斜线,则再使用黄色分别绘制了水平线与斜线。因此上面水平线被绘制了两次,看起来较粗,且最后的黄色覆盖了原来的白色。

可见,每次调用stroke方法,都会将当前默认路径下,截止到调用该方法时为止的所有子路径都全部绘制一遍。因此,我们应准备好所有的子路径后,最后才一次性地调用stroke方法。

由此,我们推出第二条结论:一条路径只能有一种颜色。如果图形中多种颜色,则需将它们分为不同的路径。将上面的代码修改如下:

// first path ctx.beginPath(); ctx.moveTo(50, 30); ctx.lineTo(150, 30); ctx.strokeStyle = 'white'; ctx.stroke(); // second path ctx.beginPath(); ctx.moveTo(150, 80); ctx.lineTo(200, 150); ctx.strokeStyle = 'yellow'; ctx.stroke();

直线

绘制直线时,一般先调用moveTo将指定位置设为当前位置。调用lineTo当前位置绘制一条直线至指定位置,且当前位置转移到指定位置。

一般用法

// first path ctx.beginPath(); ctx.moveTo(100, 30); ctx.lineTo(50, 150); ctx.lineTo(150, 150); ctx.closePath(); ctx.strokeStyle = 'yellow'; ctx.stroke();

绘制了一个等腰三角形。最后的一条边由closePath自动生成。

绘制电子表格

绘制直线原本是较为容易的,但,在绘制由直线所构成的坐标系、单元格等图形时,在确定坐标时,因不一定能整除的原因,因此需要一定的技巧。

现在,我们准备在一个任意尺寸的canvas上绘制一个电子表格,且按所指定的边距、每行多少个单元格、每列多少个单元格的要求来绘制。

let padding = 25; let xCellsNum = 7; let yCellsNum = 5; let xLinesNum = xCellsNum + 1; let yLinesNum = yCellsNum + 1; let yStart = padding; let yEnd = canvas.clientHeight - padding; let cellHeight = (yEnd - yStart) / yCellsNum; let xStart = padding; let xEnd = canvas.clientWidth - padding; let cellWidth = (xEnd - xStart) / xCellsNum; ctx.beginPath(); for (let y = yStart, i = 1; i <= yLinesNum; y += cellHeight, i++) { ctx.moveTo(xStart, y); ctx.lineTo(xEnd, y); } for (let x = xStart, i = 1; i <= xLinesNum; x += cellWidth, i++) { ctx.moveTo(x, yStart); ctx.lineTo(x, yEnd); } ctx.strokeStyle = 'gray'; ctx.stroke();

在水平方向上安排7个单元格,7为素数,不会被除了它之外的整数整除,因此每个单元格的宽度必定有小数。如果用canvas的宽度除以7作为单元格的宽度并以其作为坐标系点的位置来定位,则必然导致最后一列要么不能满足边距要求,要么会多出一个过小宽度的单元格。

而下面的代码:

for (let x = xStart, i = 1; i <= xLinesNum; x += cellWidth, i++) { ctx.moveTo(x, yStart); ctx.lineTo(x, yEnd); }

使用单元格边框线条的数量作为迭代,则可确保在精准定位开始位置的同时,又可满足每行单元格数的要求。而最后一列单元格实际上并未真正满足边距要求,但因其数值差异过小、肉眼无法分辨而被隐藏起来,从而获得非常完美的效果。

绘制坐标系也存在类似的问题。

注:上面代码:

let yEnd = canvas.clientHeight - padding; let xEnd = canvas.clientWidth - padding;

是因为本站中使用了代理的缘故,这是一个不小的话题。具体详见CanvasEditor TestCanvas 2D 概述。正常情况下,应使用:

let yEnd = canvas.height - padding; let xEnd = canvas.width - padding;

矩形

普通矩形

ctx.beginPath(); ctx.lineWidth = 5; ctx.rect(50, 30, 100, 100); ctx.strokeStyle = ColorUtils.GetRandomLightRGB(); ctx.stroke(); ctx.beginPath(); ctx.rect(200, 30, 100, 100); ctx.fillStyle = ColorUtils.GetRandomSoftRGB(); ctx.fill();

圆角矩形

指定圆角半径

let x = 30; let y = 30; let gap = 130; drawRoundRect(x, y, 10); x += gap; drawRoundRect(x, y, 20); x += gap; drawRoundRect(x, y, 30); x += gap; drawRoundRect(x, y, 40); x += gap; drawRoundRect(x, y, 50); function drawRoundRect(x, y, radii) { ctx.strokeStyle = ColorUtils.GetRandomLightRGB(); ctx.beginPath(); ctx.roundRect(x, y, 100, 100, radii); ctx.stroke(); }

上面图形,圆角半径均为一个数值。

上面各个矩形的宽度与高度均为100,而圆角半径分别为1020304050

很明显,圆角半径的大小与矩形的宽度与高度的值有关联。下面绘制出矩形4个角的内切圆。

let x = 30; let y = 30; let w = 100; let h = 100; let gap = 130; let r = 10; drawRoundRect(x, y, w, h, r); drawCircles(x, y, w, h, r); x += gap; r = 20; drawRoundRect(x, y, w, h, r); drawCircles(x, y, w, h, r); x += gap; r = 30; drawRoundRect(x, y, w, h, r); drawCircles(x, y, w, h, r); x += gap; r = 40; drawRoundRect(x, y, w, h, r); drawCircles(x, y, w, h, r); x += gap; r = 50; drawRoundRect(x, y, w, h, r); drawCircles(x, y, w, h, r); x += gap; r = 60; drawRoundRect(x, y, w, h, r); drawCircles(x, y, w, h, r); function drawRoundRect(x, y, w, h, r) { ctx.strokeStyle = 'white'; ctx.beginPath(); ctx.roundRect(x, y, w, h, r); ctx.stroke(); } function drawCircles(x, y, w, h, r) { ctx.strokeStyle = 'gray'; let _x, _y; _x = x + r; _y = y + r; ctx.beginPath(); ctx.arc(_x, _y, r, 0, Math.PI * 2); ctx.stroke(); _x = x + w - r; _y = y + r; ctx.beginPath(); ctx.arc(_x, _y, r, 0, Math.PI * 2); ctx.stroke(); _x = x + r; _y = y + h - r; ctx.beginPath(); ctx.arc(_x, _y, r, 0, Math.PI * 2); ctx.stroke(); _x = x + w - r; _y = y + h - r; ctx.beginPath(); ctx.arc(_x, _y, r, 0, Math.PI * 2); ctx.stroke(); }

当圆角半径的值为宽高值的一半时,圆角矩形已经成为一个圆。当圆角半径的值超出宽高值的一半时,依旧为圆。

圆角半径的参数为数组

可为矩形的4个角分别指定不同的圆角半径值。

let x = 30; let y = 30; let w = 100; let h = 100; let gap = 130; drawRoundRect(x, y, w, h, [10]); x += gap; drawRoundRect(x, y, w, h, [10, 20]); x += gap; drawRoundRect(x, y, w, h, [10, 20, 30]); x += gap; drawRoundRect(x, y, w, h, [10, 20, 30, 40]); function drawRoundRect(x, y, w, h, r) { ctx.strokeStyle = ColorUtils.GetRandomLightRGB(); ctx.beginPath(); ctx.roundRect(x, y, w, h, r); ctx.stroke(); }

取作为参数的圆角半径数组的元素个数:

  • 当元素个数为1时,此值分别应用于矩形的4个角。
  • 当元素个数为2时,第1个值分别应用于矩形的左上角右下角,第2个值分别应用于矩形的右上角左下角
  • 当元素个数为3时,第1个值应用于矩形的左上角,第2个值分别应用于矩形的右上角左下角,第3个值应用于矩形的右下角
  • 当元素个数为4时,这4个值分别应用于矩形的左上角右上角右下角左下角

其规律是:

  1. 从数组中依序取值,分别应用于从左上角开始顺时针旋转的4个角。
  2. 如果数组元素仅为1个,则该元素值分别应用于4个角。
  3. 如果数组元素被取尽而无剩余,则取对角的值。

圆弧

Canvas 2D通过绘制圆弧的方式来绘制圆。

arc

let x = 150; let y = 90; let gap = 200; draw4Arcs(x, y, false); draw4Arcs(x + gap, y, true); function draw4Arcs(x, y, isCounterClock) { let r = 30; let endAngle = 90; drawArc(x, y, r, endAngle, isCounterClock); r += 15; endAngle += 90; drawArc(x, y, r, endAngle, isCounterClock); r += 15; endAngle += 90; drawArc(x, y, r, endAngle, isCounterClock); r += 15; endAngle += 90; drawArc(x, y, r, endAngle, isCounterClock); } function drawArc(x, y, r, endAngle, isCounterClock) { let endRadian = Math.PI / 180 * endAngle; ctx.strokeStyle = ColorUtils.GetRandomLightRGB(); ctx.beginPath(); ctx.arc(x, y, r, 0, endRadian, isCounterClock); ctx.stroke(); }

左右两列,均从内到外,从0o开始,分别绘制了到90o180o270o360o这4个终止角度的圆弧。左列按顺时针方向绘制,右列按逆时针方向绘制。

不管时针方向,角度在坐标系中的位置都是一致的。都从右边的0o开始,顺时针旋转依序增大至360o。如下图所示:

Arc angle

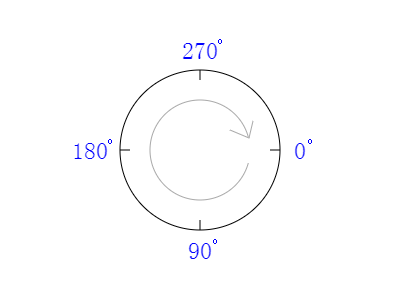
给定起始角度与终止角度,顺时针方向或逆时针方向就决定了所绘制的是长弧还是短弧。

arc中关于角度的参数必须是弧度值。弧度值与角度的转换公式:

radian = π / 180 * degree = Math.PI / 180 * degree degree = 180 / π * radian = 180 / Math.PI * radian

arcTo

let currPt = {x: 50, y: 50}; let pt1 = {x: 150, y: 50}; let pt2 = {x: 150, y: 150}; let r = 25; drawArcTo(currPt, pt1, pt2, r); drawHelpers(currPt, pt1, pt2, r); function drawArcTo(currPt, pt1, pt2, r) { ctx.beginPath(); ctx.moveTo(currPt.x, currPt.y); ctx.arcTo(pt1.x, pt1.y, pt2.x, pt2.y, r); ctx.strokeStyle = 'white'; ctx.stroke(); } function drawHelpers(currPt, pt1, pt2, r) { const HELPER_R = 5; ctx.fillStyle = 'hsla(120, 80%, 80%, 0.5)'; [currPt, pt1, pt2].forEach(pt => { ctx.beginPath(); ctx.arc(pt.x, pt.y, HELPER_R, 0, Math.PI * 2); ctx.fill(); }); }

arcTo方法所绘制的圆弧存活于3个顶点,分别是画笔当前位置、参数pt1pt2所代表的顶点。所绘制出的图形为当前位置的点到pt1的直线,再加上pt1所在的内切圆弧。

分别修改上面currPt, pt1, pt2r的值,观察运行结果。

使用arcTo,很容易绘制出一个圆角矩形。

let Point = function(x, y) { return {x:x, y:y}; }; let Rect = function(x, y, w, h) { return {x:x, y:y, width:w, height:h}; } let rect = Rect(30, 30, 200, 120); drawRoundedRect(rect, 15); function drawRoundedRect(rect, r) { let ptA = Point(rect.x + r, rect.y); let ptB = Point(rect.x + rect.width, rect.y); let ptC = Point(rect.x + rect.width, rect.y + rect.height); let ptD = Point(rect.x, rect.y + rect.height); let ptE = Point(rect.x, rect.y); ctx.beginPath(); ctx.moveTo(ptA.x, ptA.y); ctx.arcTo(ptB.x, ptB.y, ptC.x, ptC.y, r); ctx.arcTo(ptC.x, ptC.y, ptD.x, ptD.y, r); ctx.arcTo(ptD.x, ptD.y, ptE.x, ptE.y, r); ctx.arcTo(ptE.x, ptE.y, ptA.x, ptA.y, r); ctx.strokeStyle = 'white'; ctx.stroke(); ctx.fillStyle = ColorUtils.GetRandomSoftRGB(); ctx.fill(); }

椭圆

let x = 80; let y = 85; let rx = 55; let ry = 25; let rotation = 0; drawEllipse(x, y, rx, ry, rotation); x += 150; rotation += 45; drawEllipse(x, y, rx, ry, rotation); x += 150; rotation += 45; drawEllipse(x, y, rx, ry, rotation); function drawEllipse(x, y, rx, ry, rotation) { ctx.beginPath(); ctx.ellipse( x, y, rx, ry, Math.PI / 180 * rotation, 0, Math.PI * 2 ); ctx.strokeStyle = 'white'; ctx.stroke(); ctx.fillStyle = ColorUtils.GetRandomSoftRGB(); ctx.fill(); }

ellipse方法的参数与arc方法的参数类似,但圆的半径分为X轴半径及Y轴半径,以及增加了一个顺时针方向的旋转角度。

Bezier曲线

let currPt = {x: 50, y: 100}; let ctrlPt1 = {x: 100, y: 50}; let ctrlPt2 = {x: 200, y: 150}; let endPt = {x: 250, y: 100}; drawBezier(currPt, ctrlPt1, ctrlPt2, endPt); drawHelpers(currPt, ctrlPt1, ctrlPt2, endPt) function drawBezier(currPt, ctrlPt1, ctrlPt2, endPt) { ctx.beginPath(); ctx.moveTo(currPt.x, currPt.y); ctx.bezierCurveTo( ctrlPt1.x, ctrlPt1.y, ctrlPt2.x, ctrlPt2.y, endPt.x, endPt.y ); ctx.strokeStyle = 'springgreen'; ctx.stroke(); } function drawHelpers(currPt, ctrlPt1, ctrlPt2, endPt) { ctx.beginPath(); ctx.moveTo(currPt.x, currPt.y); ctx.lineTo(ctrlPt1.x, ctrlPt1.y); ctx.strokeStyle = 'gray'; ctx.stroke(); ctx.beginPath(); ctx.moveTo(endPt.x, endPt.y); ctx.lineTo(ctrlPt2.x, ctrlPt2.y); ctx.strokeStyle = 'gray'; ctx.stroke(); [currPt, endPt].forEach(pt => { fillPoint(pt, 'hsla(230, 80%, 80%, 1.0)'); }); [ctrlPt1, ctrlPt2].forEach(pt => { fillPoint(pt, 'rgba(125, 125, 125, 1.0)'); }); } function fillPoint(pt, fillStyle) { const HELPER_R = 5; ctx.beginPath(); ctx.arc(pt.x, pt.y, HELPER_R, 0, Math.PI * 2); ctx.fillStyle = fillStyle; ctx.fill(); }

bezier曲线是一条三次曲线,由当前位置的点,两个控制点,以及一个终点,共4个点来生成。

仅根据代码,很难判断bezier曲线的形态。可借用此工具在画板上直接拖动各个控制点来直观地查看效果。

Quadrtic Bezier曲线

let currPt = {x: 50, y: 100}; let ctrlPt = {x: 100, y: 50}; let endPt = {x: 250, y: 100}; drawQuadraticBezier(currPt, ctrlPt, endPt); drawHelpers(currPt, ctrlPt, endPt) function drawQuadraticBezier(currPt, ctrlPt, endPt) { ctx.beginPath(); ctx.moveTo(currPt.x, currPt.y); ctx.quadraticCurveTo( ctrlPt.x, ctrlPt.y, endPt.x, endPt.y ); ctx.strokeStyle = 'springgreen'; ctx.stroke(); } function drawHelpers(currPt, ctrlPt, endPt) { ctx.beginPath(); ctx.moveTo(currPt.x, currPt.y); ctx.lineTo(ctrlPt.x, ctrlPt.y); ctx.strokeStyle = 'gray'; ctx.stroke(); ctx.beginPath(); ctx.moveTo(endPt.x, endPt.y); ctx.lineTo(ctrlPt.x, ctrlPt.y); ctx.strokeStyle = 'gray'; ctx.stroke(); [currPt, endPt].forEach(pt => { fillPoint(pt, 'hsla(230, 80%, 80%, 1.0)'); }); [ctrlPt].forEach(pt => { fillPoint(pt, 'rgba(125, 125, 125, 1.0)'); }); } function fillPoint(pt, fillStyle) { const HELPER_R = 5; ctx.beginPath(); ctx.arc(pt.x, pt.y, HELPER_R, 0, Math.PI * 2); ctx.fillStyle = fillStyle; ctx.fill(); }

Quadrtic bezier曲线是一条二次曲线,由当前位置的点,一个控制点,以及一个终点,共3个点来生成。

仅根据代码,很难判断quadrtic bezier曲线的形态。可借用此工具在画板上直接拖动各个控制点来直观地查看效果。

参考资源

  1. HTML5 Canvas Element
  2. Canvas Path
  3. Bezier curve